Institutional targets range from $5,400 to $6,300. The Reuters analyst consensus sits at $4,746 — almost exactly where gold trades today. Here is what drives the gap between those numbers, and what long-term investors should actually be watching.
As of April 13, 2026, gold is trading at approximately $4,728 per ounce — down about 15% from its all-time high of $5,595 set on January 29, 2026, according to Bloomberg data. Institutional year-end 2026 price targets range from $5,400 (Goldman Sachs) to $6,300 (JPMorgan), with Union Bancaire Privée at $6,000, reaffirmed April 13. A Reuters poll of 30 analysts produced a median forecast of $4,746. The divergence between the base-case consensus and the high-conviction institutional targets reflects a specific scenario question: how long does the Hormuz blockade keep oil elevated, delay Federal Reserve rate cuts, and suppress Western gold ETF demand?
One of Europe’s largest private banks was buying gold on the day the gold price fell. On April 13, 2026 — the day the United States formally announced a naval blockade of Iranian ports and gold slipped — Union Bancaire Privée reaffirmed its $6,000 year-end gold target and disclosed it had rebuilt its gold allocation from roughly 3% of discretionary portfolios to approximately 6%. The bank manages $233 billion in client assets.
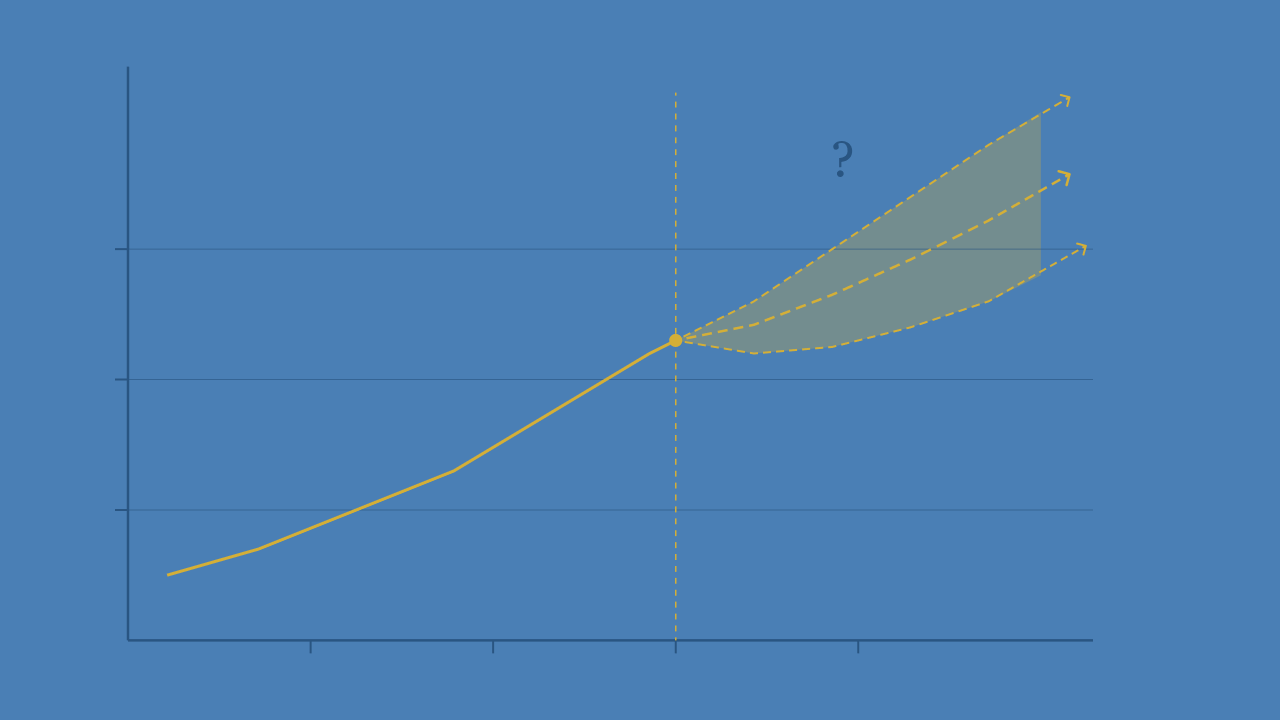
That move tells you more about the 2026 gold outlook than any price chart. The question isn’t whether gold is structurally compelling. The question is what the path looks like — and whether the mechanism currently suppressing prices is temporary or permanent.
What Are Major Banks Predicting for Gold in 2026?
Reuters Consensus
$4,746
30 analysts · median
Goldman Sachs
$5,400
+14% from spot
UBS
$5,600
+18% from spot
UBP
$6,000
+27% · reaffirmed Apr 13
JPMorgan
$6,300
+33% from spot
Current Spot
$4,728
April 13, 2026
The spread between the Reuters median ($4,746) and JPMorgan’s $6,300 is not analyst disagreement about gold’s fundamentals. Everyone in that survey agrees on the structural case. The disagreement is about timing — specifically about when the Hormuz-oil-inflation feedback loop breaks and the Federal Reserve resumes rate cuts.
JPMorgan’s commodity research desk models approximately 800 tonnes of central bank gold buying for 2026 — broadly in line with the World Gold Council’s official 2025 figure of 863 tonnes. JPMorgan’s own quantitative framework holds that every 100 tonnes of committed-buyer purchasing corresponds to approximately a 1.7% increase in gold price. At 800 tonnes, structural demand alone supports prices well above current levels, independent of ETF flows.
Why Did Gold Fall from Its January All-Time High?
The mechanism is specific and worth understanding precisely — because it reveals when the headwind reverses. We’ve explained the full mechanism in detail here. The condensed version:
When the US and Israel struck Iran on February 28, 2026, the Strait of Hormuz was restricted. Oil surged past $100 per barrel. Bureau of Labor Statistics March 2026 CPI data showed 3.3% year-over-year inflation — the highest since May 2024 — with a 0.9% monthly jump. That inflation reading locked the Federal Reserve in place at 3.50–3.75%. The CME FedWatch tool shows 0% probability of an April cut and only 30% probability of at least one cut by December 2026.
When rate cuts are priced out, the 10-year Treasury Inflation-Protected Securities (TIPS) real yield — the inflation-adjusted return on government bonds — stays elevated. At approximately 1.94% as of April 10, it creates a meaningful opportunity cost for holding non-yielding gold. Western gold ETF investors responded with record redemptions: over $12.7 billion in North American outflows in March 2026 alone, per State Street’s April 2026 monthly gold monitor — the largest monthly outflow in at least five years.
The paradox of the war-driven gold decline
Gold fell during an active war because the war’s inflation effect prevented the rate cuts that would have driven ETF inflows. The war worked against gold’s most rate-sensitive buying channel — even as rate-insensitive central banks continued buying steadily.
What Would Push Gold Above $5,000 in 2026?
Goldman Sachs quantifies the ETF mechanism precisely: each 25 basis point Federal Reserve rate cut generates approximately 60 tonnes of new gold ETF demand within six months. Three cuts in 2026 — a scenario that required oil to fall and CPI to moderate — would imply roughly 180 additional tonnes of ETF demand. Combined with the approximately 800 tonnes of central bank buying JPMorgan models, that total demand would be well above the 350-tonne quarterly threshold above which prices typically rise, per JPMorgan’s own demand-tonnage framework.
The trigger does not require a geopolitical resolution. It requires oil prices to fall enough that CPI moderates and rate cut pricing re-enters the market. The historical precedent from the 2019 rate cycle is instructive: when the Fed cut rates in July 2019 for the first time in over a decade, gold rallied approximately 7% in the six weeks that followed. The 2026 structural backdrop — central bank buying at 5x its pre-2022 pace and ETF holdings below the 2020 peak — suggests a meaningfully larger potential response.
The Goldman Conviction Buyer Framework
Goldman Sachs models gold through three committed-buyer channels: ETFs (rate-sensitive Western capital), central banks (structural geopolitical hedgers), and COMEX speculators (mean-reverting noise). Every 100 tonnes of net committed-buyer purchasing corresponds to approximately a 1.7% gold price increase. Central banks are currently buying roughly 1,000 tonnes annually. ETF flows are the swing factor — and they are positioned for re-entry when rates fall.
What Is the Structural Long-Term Case for Gold?
The 2026 price forecast matters less than the structural thesis for investors with a 7-plus-year horizon. That thesis has three compounding components:
Debasement. The US federal deficit is running at approximately 6–7% of GDP at full employment. Federal interest expense is approaching $1 trillion annually. Moody’s downgraded US sovereign debt in May 2025, making it the third major rating agency to do so. From 1971 — when the US abandoned dollar-gold convertibility — through 2025, gold rose from $35 per ounce to over $5,000 while the dollar lost approximately 87% of its purchasing power, per Bureau of Labor Statistics CPI data. The inflation hedge evidence is examined in depth here.
De-dollarization. The freezing of Russia’s $300 billion in foreign exchange reserves in 2022 was a structural wake-up call. WGC data shows central bank gold purchases averaged approximately 1,000 tonnes per year from 2022–2025, versus roughly 200 tonnes per year in the prior decade. China’s People’s Bank of China reached an all-time high of approximately 2,309 tonnes of official gold reserves in Q1 2026. This reserve composition shift has years to run.
Institutional underweight. Despite gold being 80% higher since early 2025, global gold ETF holdings remain below the November 2020 peak of approximately 3,929 tonnes. The Western institutional re-entry — Goldman Sachs estimates it as a key component of any move toward the high-conviction price targets — represents the next potential demand leg.
What Is the Bear Case for Gold in 2026?
State Street assigns a 20% probability to a scenario where gold ends 2026 between $4,000 and $4,750. The conditions: oil sustaining above $120–$150, CPI reaccelerating toward 4–5%, and the Fed responding with hikes. Real yields would rise further; ETF outflows could accelerate beyond the record March pace. This is a real scenario. It requires a sustained worsening in energy conditions beyond current market expectations, but it is not negligible.
The bear case for investors to weigh honestly is not primarily a 2026 problem. It’s a patience problem. Gold underperformed meaningfully from 2012 to 2018, a six-year period during which the structural debasement thesis was equally valid. An investor who entered at the 2011 peak did not see a recovery to that level until 2020. Conviction in the long-term thesis does not eliminate the possibility of multi-year drawdowns. Position sizing and time horizon matter as much as analytical correctness.
Bull Case — 30% probability
Ceasefire leads to oil normalization → CPI relief → Fed cuts → ETF re-entry → $5,400–$6,300 range by year-end.
Base Case — 50% probability
Blockade continues, range-bound $4,300–$5,200. ETF headwind offset by central bank floor. No major breakout in 2026.
Bear Case — 20% probability
Oil above $120 → CPI 4–5% → Fed hikes → ETF outflows accelerate → $4,000–$4,750.
What Should Long-Term Investors Actually Watch?
The single most important forward indicator for gold is not the gold price itself — it is the 10-year TIPS real yield. When that yield falls, gold’s most rate-sensitive buying channel re-opens. Goldman Sachs research links each 25 basis point decline in the real yield to a roughly $40–$60 per ounce move in gold.
Three signals to track weekly
WGC ETF flow data (published each Thursday) · CME FedWatch December 2026 cut probabilities · Strait of Hormuz transit volumes (currently ~12 vessels/day vs. normal 20+). When these three shift — real yields lower, cut probabilities higher, Hormuz recovering — the path from $4,728 to institutional targets becomes mechanically clear.
For a long-term investor who has established their target allocation, none of this surveillance is urgent. The structural thesis is measured in years. The current suppression mechanism is cyclical. Central bank demand is not.
- Gold is at $4,728 as of April 13, 2026 — down 15% from its January 29 all-time high of $5,595. The decline reflects a specific, reversible mechanism: oil-driven inflation delaying rate cuts and suppressing ETF demand.
- Institutional year-end 2026 targets range from $5,400 (Goldman Sachs) to $6,300 (JPMorgan). The Reuters 30-analyst median is $4,746 — essentially current spot. The gap is scenario divergence, not fundamental disagreement.
- The primary near-term catalyst for a rally is Federal Reserve rate cut pricing. Each 25bp cut generates approximately 60 tonnes of new ETF demand within six months, per Goldman Sachs research.
- The structural case — approximately 1,000 tonnes per year of central bank buying, US fiscal deterioration, Western institutional underweight — is intact and reinforced by the current conflict.
- The bear case (20% probability per State Street) requires sustained oil above $120 and CPI reaccelerating to 4–5%. It is real but minority in current market pricing.
Build your gold position before the next catalyst. GBI Direct offers fully allocated gold storage through Brinks and Loomis vaults — institutional custody, live-market pricing, accounts open in under 10 minutes. Open your account →
This article is for informational and educational purposes only and does not constitute financial, investment, or legal advice. Precious metals involve risk, including the possible loss of principal. Past performance is not indicative of future results. Price forecasts represent third-party analyst estimates and are not guarantees of future performance. GBI Direct does not provide personalized investment advice. Please consult a qualified financial professional before making investment decisions.
What is the gold price forecast for 2026?
As of April 2026, institutional year-end gold price forecasts range from $5,400 (Goldman Sachs) to $6,300 (JPMorgan). Union Bancaire Privée targets $6,000, reaffirmed April 13, 2026. UBS holds a $5,600 target. A Reuters poll of 30 analysts produced a median forecast of $4,746 — nearly exactly current spot of $4,728. The wide range reflects scenario divergence around the Hormuz blockade timeline and its impact on Federal Reserve rate policy.
Why did gold fall from its all-time high?
Gold hit an all-time high of $5,595 per ounce on January 29, 2026, then fell approximately 15% to around $4,728 by April 13, 2026. The Hormuz blockade sent oil above $100 per barrel, pushing March 2026 CPI to 3.3% year-over-year. Elevated inflation prevented the Federal Reserve from cutting rates. Higher real Treasury yields create an opportunity cost for holding non-yielding gold, suppressing Western ETF demand. This is a cyclical headwind, not a structural breakdown.
Will gold go up in 2026?
The structural drivers for gold — approximately 1,000 tonnes per year of central bank buying, US fiscal deficits running at 6–7% of GDP, and global reserve diversification away from the dollar — remain intact as of April 2026. JPMorgan models central bank buying of approximately 800 tonnes in 2026, providing a structural floor. Most institutional forecasters see gold higher by year-end 2026 from current levels. The primary catalyst is a resumption of Federal Reserve rate cuts, which Goldman Sachs estimates would generate approximately 60 tonnes of new ETF demand per 25bp cut within six months.
What is the bear case for gold in 2026?
State Street assigns a 20% probability to a scenario where gold ends 2026 in the $4,000–$4,750 range. This requires oil prices sustaining above $120 per barrel, inflation reaccelerating toward 4–5%, and the Federal Reserve holding rates or tightening further. In this scenario, real yields would rise and ETF outflows could accelerate. The bear case is real but requires conditions beyond current market expectations.