
The January spike was the headline. The $800 pullback was the noise. The structural shift is what matters.
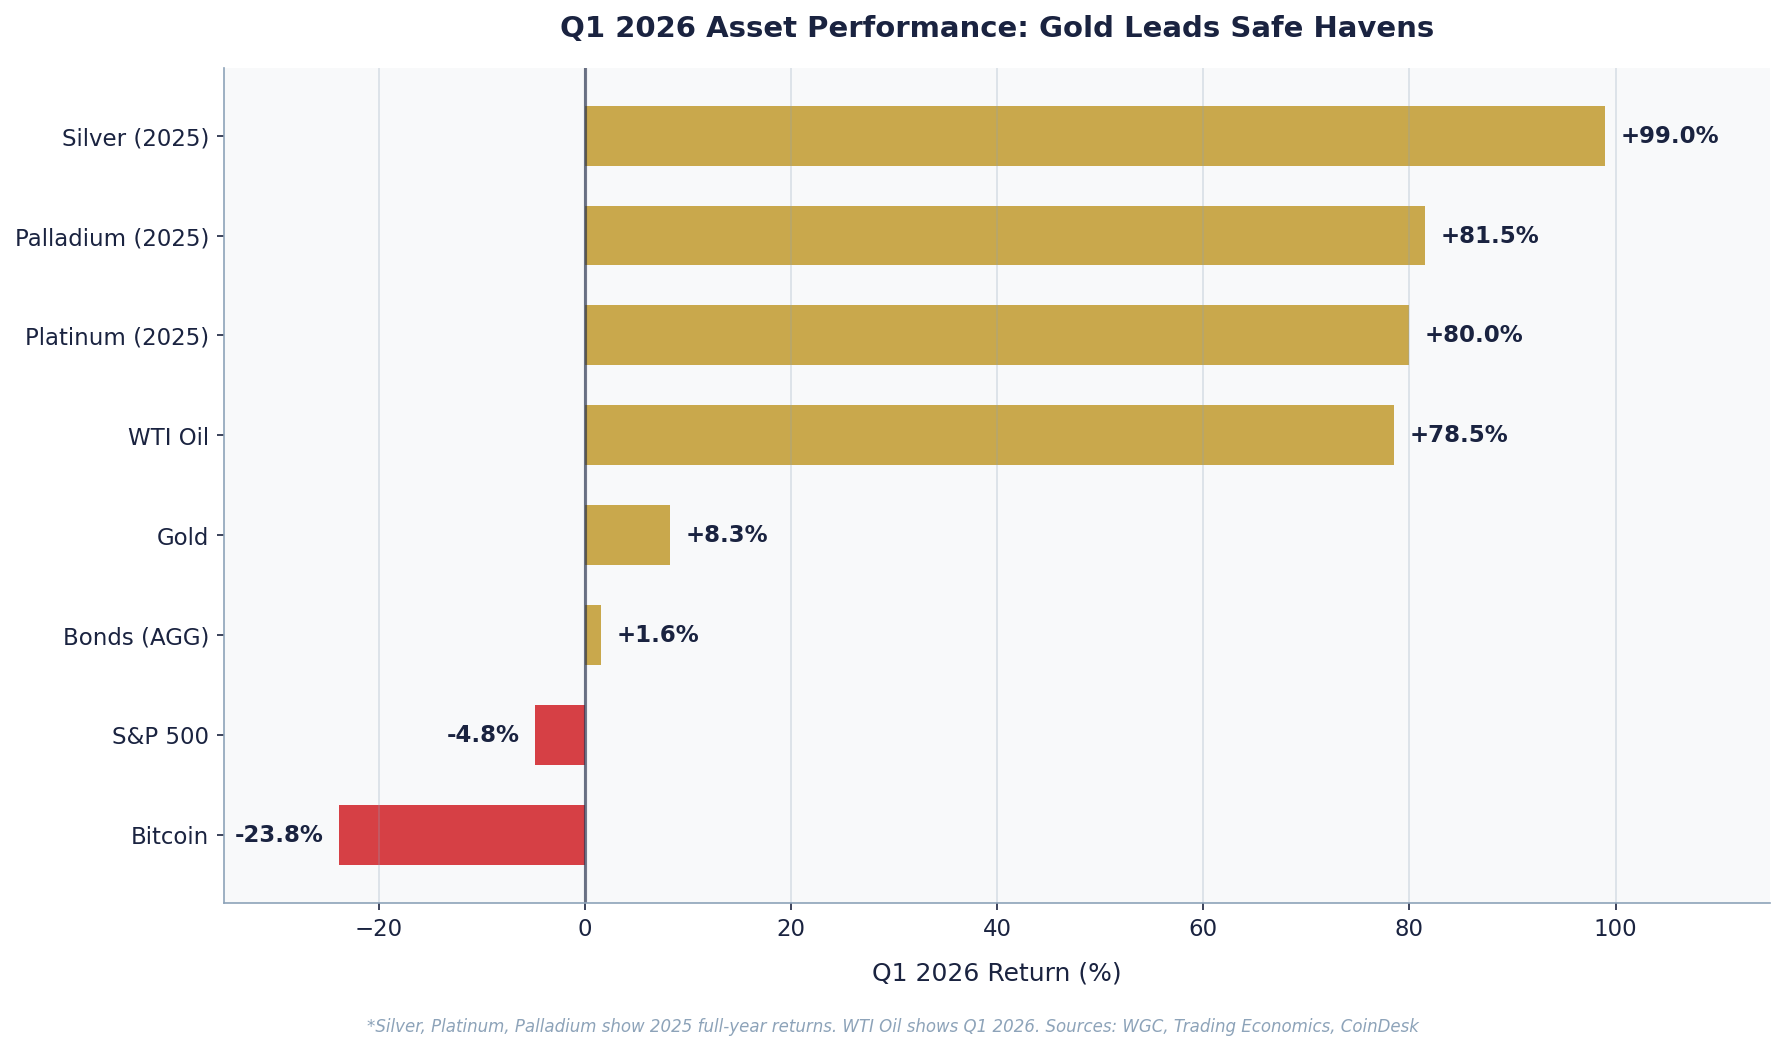
On January 28, gold touched $5,589. Then it fell $800. Then the quarter closed and it was still up 8.3%—outperforming the S&P 500, bonds, and Bitcoin by wide margins.
What looks like volatility on the surface is actually something more important: a stress test the asset passed. Every scenario played out in Q1—geopolitical shock, equity drawdown, energy crisis, sticky inflation. Gold held its ground in all of them. That’s not a trade. That’s a thesis being confirmed.
Meanwhile, WTI crude surged 78.5% on Iran’s effective closure of the Strait of Hormuz, Bitcoin had its worst quarter since 2018, and the S&P 500 posted its largest quarterly loss since 2022. The quarter reshuffled every assumption about which assets belong in a portfolio built for this environment. Here’s the structural read.
Q1 2026: The Asset Performance Scorecard
The quarter offered a masterclass in asset divergence—between real assets and financial assets, between safe havens and risk assets, between commodities tied to geopolitical disruption and those driven by structural monetary demand.
The read-through is clear: real assets with physical supply constraints or monetary store-of-value properties outperformed or held. Financial assets denominated in a weakening dollar or tied to risk appetite did not. This is not noise—it is a structural signal.
What Drove the Quarter—and Why Oil and Gold Told the Same Story
To understand Q1 2026, you need one date: March 2, 2026. That is when Iran declared an effective closure of the Strait of Hormuz—the chokepoint through which roughly 20% of the world’s traded oil passes. WTI crude, which had opened the year at ~$57.72, surged toward $100+ by end of quarter, posting a +78.5% return that ranks among the largest single-quarter moves in oil market history.
Gold told the same geopolitical story, but had already front-run it. Gold’s intra-quarter peak of $5,589.38 on January 28 occurred six weeks before the Hormuz closure—driven by the broader Israel-Iran tension escalation and a weakening US dollar. By the time Iran made its March declaration, gold had already partially retraced, which is why it closed Q1 “only” +8.3% rather than the +27.5% peak gain.
This divergence is instructive. Gold is a forward-looking monetary asset. Oil is an energy commodity with real-time supply sensitivity. In Q1, both confirmed the same geopolitical thesis, just on different timelines.
WTI Oil’s +78.5% Q1 surge was driven primarily by supply disruption. Gold’s +8.3% quarter-end return reflects monetary demand and de-dollarization trends that persist regardless of geopolitical resolution. When oil normalizes as tensions ease, gold’s structural bid from central banks remains.
The S&P 500 Divergence: Why Equities Didn’t Work as a Safe Haven
The S&P 500’s -4.8% Q1 return—closing at 6,528.52 on March 31 from 6,858.47 at the year’s open, with the Magnificent Seven down 13% year-to-date—is significant context for gold holders. Rising energy prices create cost pressure across corporate earnings. Sticky inflation at 3.06% core PCE reduces the probability of near-term rate cuts. And the same geopolitical risk premium that drove gold and oil higher created uncertainty that risk assets typically cannot absorb cleanly.
The result: gold’s 13-point outperformance over the S&P 500 in a single quarter is exactly the kind of uncorrelated return long-term portfolio builders position for. The 15% intra-quarter correction in gold—from $5,589 to a March trough—did not erase that advantage. That spread is the portfolio diversification case in action.
Are Central Banks the New Bull Market? The De-Dollarization Structural Shift
If geopolitical risk was Q1’s surface story, central bank demand is the structural story that will define 2026 and beyond.
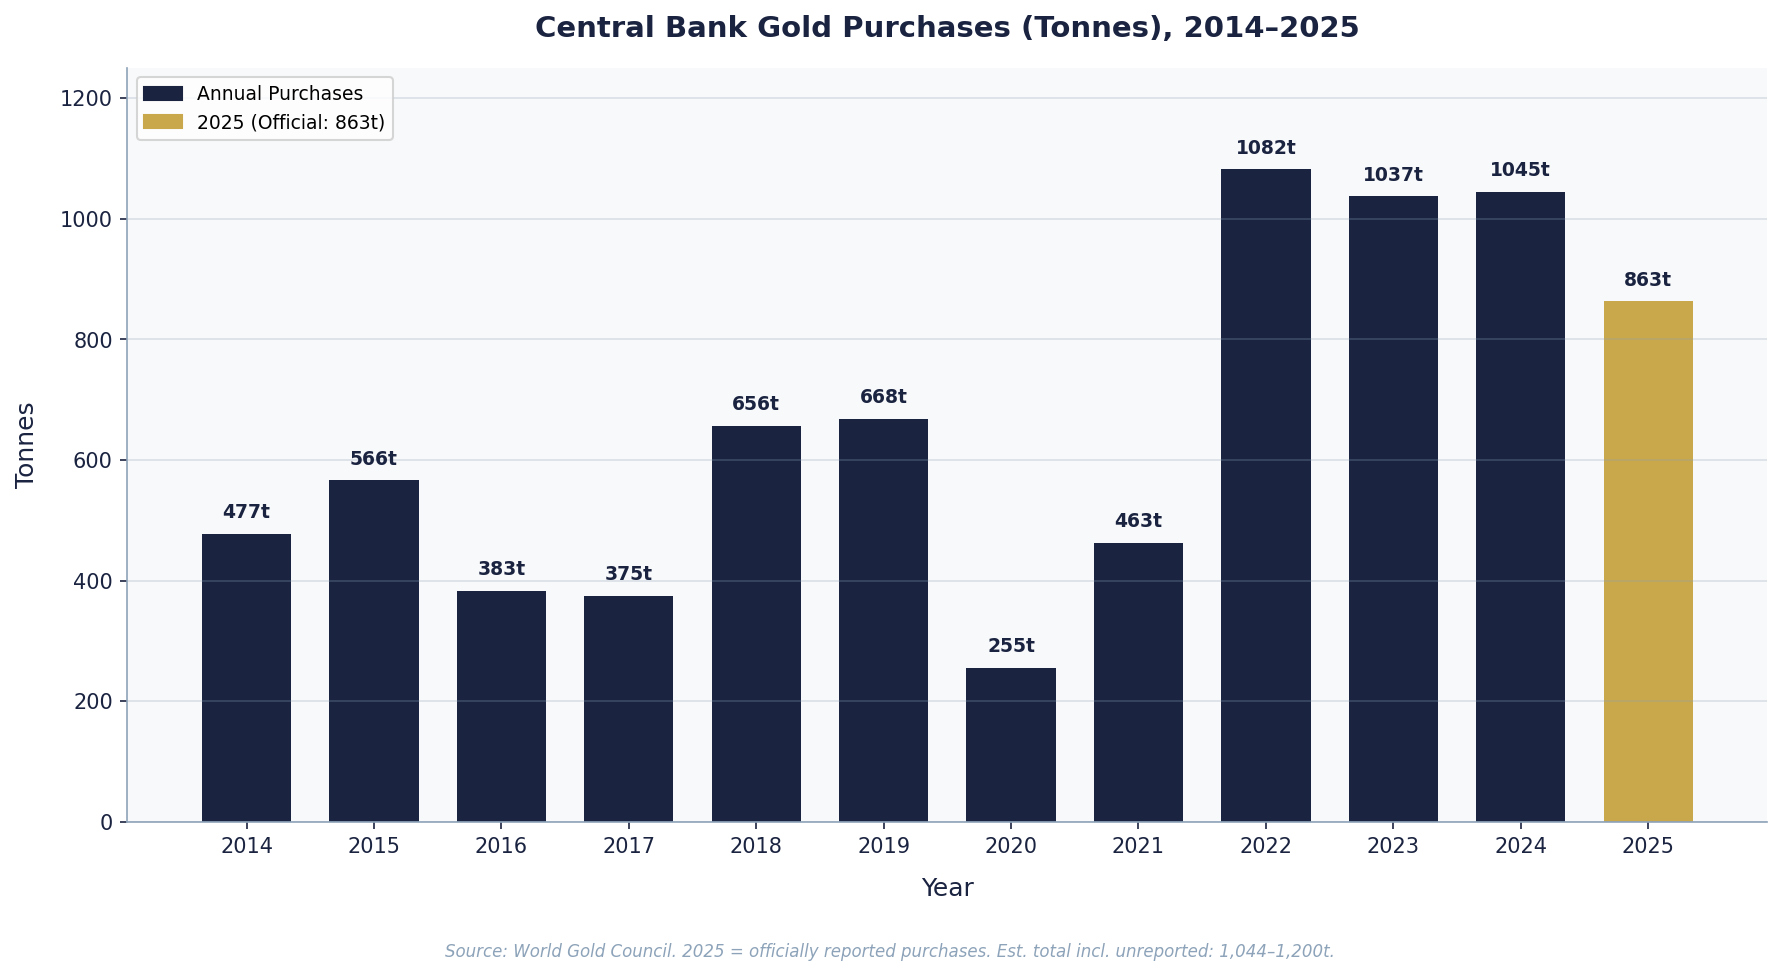
The World Gold Council reported that central banks added 863.3 tonnes of gold to their reserves in 2025. Some analysts estimate total demand reached 1,044–1,200 tonnes when including unreported buying. A WGC survey found that 43% of central banks plan to increase their gold holdings in the coming year—and critically, 0% plan to decrease. Poland has publicly set a target of holding 20% of its reserves in gold. BRICS+ nations now hold an estimated 17–21% of global central bank reserves in gold.
This is not cyclical. This is structural. Central banks do not trade. They accumulate and hold. When 43% of the world’s reserve managers are in simultaneous accumulation mode, you are not looking at a technical driver—you are looking at the foundation of a multi-year bull market.
Real Yields: The Market Is Pricing in Goldilocks. It Shouldn’t.
Current real yields (10-year nominal Treasury minus inflation expectations) are estimated at 1.5–1.8%. This is the market’s current assessment: the Fed will stay restrictive enough to keep returns positive in real terms, but not so restrictive that growth breaks. But Q2 will test this assumption. Core PCE remains at 3.06%—stubbornly above the Fed’s 2% target—and oil’s Q1 surge has not yet fully passed through to headline CPI.
Core PCE stays above 3.0% through Q2; energy passthrough hits headline; Fed holds. Real yields rise toward 2.0–2.2%. Gold consolidates near current levels; central bank demand provides floor.
CPI or PCE data soften; June rate cut crystallizes. Real yields compress toward 1.0–1.3%. Gold rallies decisively—likely testing the January highs toward $5,400–$5,589.
Oil’s surge keeps headline inflation elevated while growth falters. Fed eventually cuts aggressively. Real yields go negative. Gold surges. This is the scenario institutional bulls are pricing into their $5,800–$6,300 targets.
Gold wins in scenarios 2 and 3. The asymmetry is clear—upside optionality exceeds downside risk at current levels.
What About Silver and Platinum? The Upside Leverage Angle
All four major precious metals posted positive Q1 returns—and that broad-based strength reflects the same macro tailwinds: compressed real yields, geopolitical risk, and central bank diversification. Silver, platinum, and palladium offer what investors call convexity—meaning they tend to move more than gold on a percentage basis when gold rallies, giving holders amplified upside if the bull case plays out. Think of it as getting more potential return per dollar invested when the tide is already rising.
Silver, having posted a 99% gain in 2025, entered Q1 with momentum. The silver-to-gold ratio at approximately 45:1 suggests silver may significantly outperform if gold moves decisively higher. Historically, when gold breaks above $5,200–$5,400, silver has accelerated toward $120–$140 per ounce. Platinum and palladium carry structural supply challenges—90% of global supply concentrated in Russia and South Africa—that support prices irrespective of the gold cycle. For 7+ year holders: gold is the foundation, but the full precious metals complex offers diversification with amplified upside potential.
Q2 2026: What to Watch
WTI at ~$103 reflects the Q1 geopolitical shock. If Hormuz tensions ease, oil could retrace toward $75–$85. Watch for inflation passthrough into April CPI and whether normalization shifts the Fed’s posture.
The May and June FOMC meetings are critical. Any shift toward cuts would compress real yields and create a powerful precious metals tailwind. Watch CPI and PCE for evidence inflation is moderating.
If equity markets continue to underperform—earnings pressure from energy costs, rate uncertainty—capital rotation toward real assets accelerates. Watch Mag Seven earnings in late April.
The Strait of Hormuz remains the highest-impact binary for both oil and gold in Q2. Escalation sends both above prior peaks; resolution allows partial normalization, but gold’s structural bid remains intact regardless.
The DXY declined 1.2% in March to ~100.22. A break below 98 would be a significant tailwind for gold globally.
The WGC releases Q1 2026 purchasing data in late Q2. Confirmation of 750+ tonnes annualized reinforces the structural bull narrative independent of geopolitical outcomes.
Institutional Gold Price Targets for 2026:
- Gold returned +8.3% in Q1 2026 despite a 15% intra-quarter correction, outperforming the S&P 500 (–4.8%), Bitcoin (–23.8%), and bonds — confirming its role as a stress-tested portfolio anchor.
- WTI crude surged +78.5% following Iran’s effective closure of the Strait of Hormuz on March 2 — the single most important macro event of the quarter for both oil and gold.
- Central banks added 863 tonnes of gold in 2025, with 43% planning further increases and 0% planning decreases — a structural demand floor independent of geopolitical cycles.
- Gold wins in both a rate-cut scenario (real yield compression) and a stagflation scenario (negative real yields) — the asymmetric upside case for Q2 and beyond remains intact.
- Institutional targets range from $5,000 (Bank of America) to $6,300 (JPMorgan bullish case), implying 5–33% upside from the April 1 close of $4,749.
- Key risk: A geopolitical de-escalation in the Strait of Hormuz combined with faster-than-expected inflation moderation could compress real yields less aggressively, limiting near-term upside for gold.