Gold is near $4,700. It feels expensive. But the question isn’t whether the price is high — it’s what that price actually buys. The 55-year purchasing power record tells a specific story about dollars and ounces.
The price of gold is not the right place to start
When investors ask “is it too late to buy gold?” they are almost always asking the wrong question. They are looking at the dollar price — $4,700 per ounce — and comparing it to a price they remember from five or ten years ago, when gold was $1,300 or $1,800. In dollar terms, gold looks expensive.
The more useful question is: what does one ounce of gold actually buy today, compared to what it bought fifty-five years ago? That question reframes the analysis from one about the dollar price of gold to one about the purchasing power of gold versus the purchasing power of dollars. And the 55-year record produces a specific answer that is worth examining carefully.
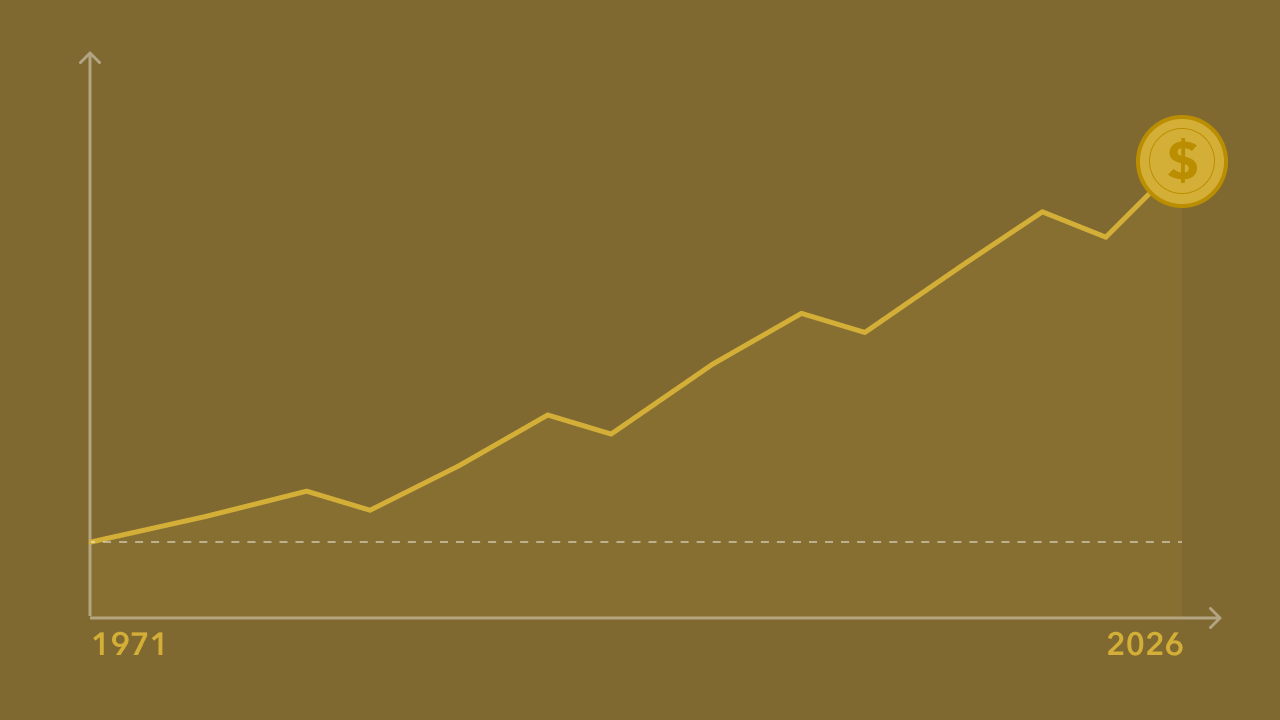
On August 15, 1971, President Nixon closed the gold window — the mechanism by which dollars could be exchanged for gold at a fixed rate of $35 per ounce. That event effectively began the modern era of fiat currency. What has happened to the purchasing power of dollars and gold in the 55 years since is the empirical foundation of the gold investment thesis.
What one ounce of gold bought in 1971 — and what it buys today
Gold is currently trading near $4,738 per ounce — approximately 135 times its $35 price at the Nixon gold window. The following comparison converts the prices of common assets into ounces of gold, then and now. Click each item to see the detail.
Gold purchasing power — ounces required to buy the median US home
The house got cheaper in gold. It got more expensive in dollars. Toggle to compare.
Source: National Association of Realtors (median home price); NAHB (1971 data); TradingEconomics (gold spot). Gold price approximate for intermediate years.
The structural forces driving gold are compounding — not easing
The purchasing power record above is a historical observation. The forward-looking question is whether the conditions that produced it — dollar debasement, fiscal deterioration, declining purchasing power of fiat currency — are still in place, still intensifying, or resolving.
U.S. federal debt stands at approximately $39 trillion — equal to roughly 150% of GDP. The federal deficit is running at approximately 6–7% of GDP at full employment. Annual interest costs on the federal debt are approaching $1 trillion — more than the entire defence budget. Moody’s became the third major credit rating agency to downgrade the United States in May 2025, joining S&P and Fitch. These are not historical artefacts of the 1970s. They are current data points that represent an intensification of the structural conditions that drove the 55-year purchasing power divergence between gold and dollars.
GBI economist Trey Reik identifies three structural forces driving the current gold cycle: fiscal deterioration and dollar debasement, central bank diversification away from dollar-denominated reserve assets, and anti-dollar sentiment building across the emerging market sovereign world. All three are present today. All three are intensifying, not easing. The question “is it too late?” assumes the forces driving gold’s advance are mature and about to reverse. The structural data suggests they are not.
The central bank signal
Central banks globally purchased a net 244 tonnes of gold in Q1 2026 — a pace consistent with the 1,000+ tonne annual buying rate that has characterised the post-2022 regime. These institutions are not making quarterly trading decisions. They are making decade-long reserve allocation decisions based on a structural assessment of the global monetary system. When sovereign institutions with $14 trillion in combined reserves are accumulating gold at the fastest pace in modern history, the question of whether it is “too late” takes on a different character. These buyers are not late. They are deliberate.
Gold is down today — and the structural case is unchanged
Gold fell from $4,773 to approximately $4,694 today after April CPI printed above consensus at 3.8% — with core also beating at 2.8%. The mechanism is familiar: hotter inflation keeps the Fed on hold or raises hike risk, which elevates real yields, which raises the opportunity cost of holding a non-yielding asset. Gold falls.
This near-term mechanism is real and operates repeatedly. But it is worth putting it in context of the 55-year receipt. In 1971, gold was $35 per ounce. Every time since then that gold has faced a rate headwind, a hot inflation print, or a dollar surge, the same question has been asked: is it too late? In 2005, gold was at $450 — is it too late? In 2011, gold was at $1,900 — is it too late? In 2022, gold was at $1,700 — is it too late?
The answer has always been the same in structure: the near-term tactical headwinds are real, the structural forces driving purchasing power erosion are larger and more durable than the tactical headwinds, and the investors who asked “is it too late” and decided it was have, in most cases, been wrong over a 5–10 year horizon. That does not mean gold goes up in any given month or quarter. It means the framework for evaluating the question needs to match the timeframe of the investment.
Gold — 25-year cumulative return vs selected assets
Long-term purchasing power comparison. S&P 500 shown on price basis only — total return (including dividends) would be significantly higher.
Source: GBI research based on Bristol Gold Group / Trey Reik analysis. S&P 500 = price return only, excluding dividends. Past performance is not indicative of future results.
“The question isn’t whether $4,700 gold is expensive. It’s whether the forces that took gold from $35 to $4,700 are still in place. The fiscal data, the central bank data, and the deficit data all suggest they are.”
- Since Nixon closed the gold window in 1971, one ounce of gold has gone from buying 720 oz of the median home to 86 oz — the home became 8× cheaper in gold, 16× more expensive in dollars
- In gasoline terms: 1 oz bought 100 gallons in 1971. Today it buys over 1,057 gallons — despite Brent at $107
- S&P 500 comparison is price-only — gold has nearly doubled its purchasing power in S&P price units, but the S&P total return (with dividends) significantly outperforms gold over 55 years
- The structural forces driving the purchasing power divergence — fiscal deterioration, dollar debasement — are intensifying, not resolving
- Central banks bought net 244 tonnes in Q1 2026 at these prices — the institutions with the longest time horizons are still accumulating
- “Too late” is a timeframe question. Over a 5–10 year horizon, the structural conditions that have driven gold’s purchasing power advance since 1971 are present and intensifying
Own gold the professional way. GBI Direct offers fully allocated gold and silver storage through Brinks and Loomis vaults, with institutional-grade custody and live-market liquidity. Accounts open in under 10 minutes.
Sources: National Association of Realtors (median home price Q1 2026: $408,800); NAHB (1971 median home price ~$25,200); U.S. Energy Information Administration (gasoline prices); TradingEconomics (gold spot price); World Gold Council Q1 2026; GBI economist Trey Reik / Bristol Gold Group research; U.S. Treasury (federal debt and deficit); Moody’s (U.S. downgrade, May 2025).
Not financial advice. For educational purposes only. Past performance is not indicative of future results. The S&P 500 price-only comparison excludes dividend reinvestment; total return data would show different results.