IRENA published data showing solar-plus-storage now delivers power at $54–82/MWh — below new coal at $85/MWh. When the cheapest new power source requires silver in every cell, this cost crossing matters for the silver market.
$54–82/MWh · vs $85+/MWh · −87% since 2010
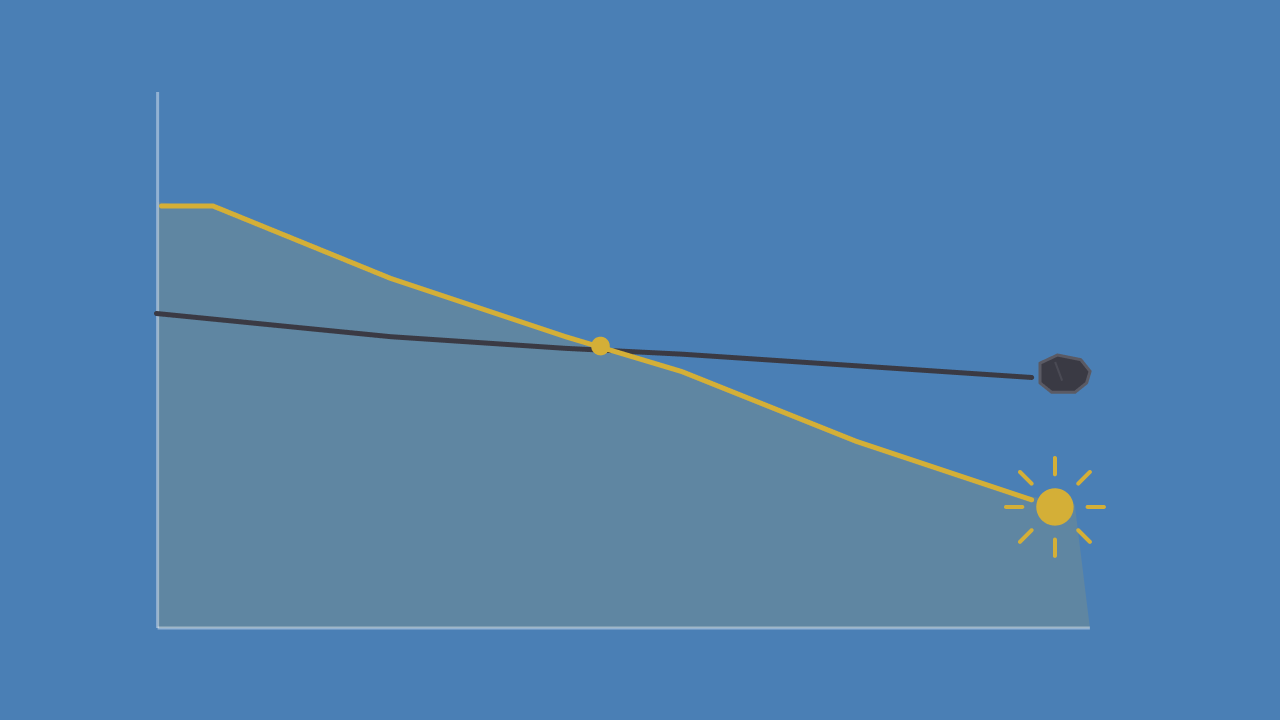
Solar-plus-storage cost (high-irradiance regions) · vs new coal · solar cost reduction since 2010
The cost crossing that changes the economics of every new power plant decision
The International Renewable Energy Agency published its report “24/7 Renewables: The Economics of Firm Solar and Wind” this week, containing a data point that deserves more attention than it has received in the financial press. In high-irradiance regions — which includes most of the developing world where energy infrastructure is being built fastest — solar photovoltaic systems paired with battery storage now deliver firm, round-the-clock power at a levelised cost of $54–82 per megawatt-hour.
New coal in China — the cheapest new fossil fuel generation available anywhere — costs $85/MWh. New gas globally exceeds $100/MWh. Solar-plus-storage has crossed below the cheapest new fossil fuel alternative, in current-year data, not in a projection. The economics of new power generation have fundamentally shifted in the past five years, and IRENA’s report marks the point at which that shift became unambiguous.
Since 2010, the total installed cost of solar has fallen 87%. Onshore wind has fallen 55%. Battery storage has fallen 93%. IRENA projects these costs will decline a further 30% by 2030 and 40% by 2035. The cost advantage of renewables over fossil fuels is not a projection of future competitiveness. It is already present in current-year data, and it is expected to widen further.
Levelised cost of electricity — solar+storage vs new fossil fuels ($/MWh)
Solar-plus-storage crossed below new coal in high-irradiance regions. The cost gap widens further by 2030 and 2035 per IRENA projections.
Source: IRENA, “24/7 Renewables: The Economics of Firm Solar and Wind” (May 2026). High-irradiance regions. Solar+storage range shown as midpoint ($68/MWh). New gas = global average.
Every solar cell contains silver. The cost crossing accelerates the deployment that drives the demand.
Silver is used to form the conductive lines — called busbars and fingers — that collect electricity from a solar cell and channel it to the grid. It is the metal with the highest electrical conductivity of any element, and no commercially viable substitute at scale has been developed despite years of research. The Silver Institute reported that solar photovoltaic manufacturing consumed 197.6 million ounces of silver in 2024, against approximately 400 GW of new solar capacity — roughly 0.5 million ounces per gigawatt.
The IRENA cost data matters for silver because it changes the economic calculation facing every energy planner, utility company, and government infrastructure minister building new power generation capacity. When solar-plus-storage is cheaper than new coal and significantly cheaper than new gas, the decision to build new fossil fuel generation requires justification rather than being the default. The cost crossing IRENA documented this week means solar is not just the environmentally preferred option in high-irradiance regions — it is now the economically preferred option. That accelerates deployment. And deployment embeds silver.
Silver demand calculator
Solar deployment → silver demand
Annual silver demand
200M oz
at 0.5M oz per GW (Silver Institute 2024 data)
% of annual mine supply
24.4%
Global mine production: ~820M oz/yr (Silver Institute)
The Hormuz conflict is driving the same deployment the IRENA data supports
The IRENA cost data establishes the structural economic case for solar deployment. The current energy crisis provides the near-term accelerant. Ember research published in April confirmed that China exported 68 gigawatts of solar products in March 2026 alone — equivalent to Spain’s entire installed solar capacity, shipped in thirty days. The regions showing the fastest growth were precisely those most affected by the energy crisis: India (+141% month-on-month), Africa (+176%), with Nigeria, Ethiopia and Kenya each setting all-time monthly import records.
Countries absorbing elevated energy costs are not waiting for the Hormuz ceasefire before building domestic solar generation. They are accelerating deployment now, through the most cost-competitive supply chain available. The energy crisis that is generating the oil inflation that is suppressing silver’s near-term monetary price is simultaneously accelerating the solar deployment that builds silver’s structural industrial floor. The same crisis. Two opposite effects on silver’s price. The near-term monetary effect is visible in today’s price. The structural industrial effect is visible in the deployment data.
The technology shift making it worse for supply
The solar industry is migrating from legacy PERC cell technology toward TOPCon and heterojunction (SHJ) architectures — higher efficiency, but requiring silver on both sides of the cell rather than just the front. Ghent University research (2025) quantified the difference: TOPCon requires 1.5× more silver per GW than PERC; SHJ requires 2×. As IRENA’s cost data accelerates deployment volumes and the industry simultaneously migrates to more silver-intensive cell architectures, the aggregate demand signal runs in one direction regardless of per-unit efficiency gains.
Demand is growing structurally. Supply cannot respond at the same pace.
The supply side of the silver equation has a structural feature that prevents it from responding quickly to demand growth: approximately 70% of global silver is mined as a byproduct of copper, lead, and zinc mining. Production decisions at these mines are driven by base metals economics — not silver prices. A copper mine expands because copper demand warrants it, not because silver is needed for solar cells. The 30% that comes from primary silver mines requires five to eight years from discovery to production. There is no supply sprint available.
The Silver Institute has recorded four consecutive annual supply deficits through 2024, with the projected 2026 shortfall at 46.3 million ounces. The cumulative draw on above-ground stocks since 2021 exceeds 444 million ounces. Against a backdrop where IRENA’s cost data is accelerating solar deployment globally, where the industry is migrating to more silver-intensive cell architectures, and where supply cannot respond to price signals on anything less than a 5–8 year timeline, the structural demand-supply imbalance is not a short-term phenomenon. It compounds annually.
Silver supply deficit — million ounces per year
Four consecutive years of structural shortfall. The IRENA cost crossing accelerates the demand side. Supply cannot sprint to catch up.
Source: Silver Institute World Silver Survey 2024/2025. 2026 = Silver Institute projection. Cumulative 2021–2024 deficit: ~444M oz.
Investor implication: The IRENA cost crossing is the structural accelerant for silver’s industrial demand floor. Solar deployment was already the primary driver of silver’s supply deficit. A world where solar is now the cheapest new power source — and where cell architecture is becoming more silver-intensive — widens that structural deficit on a multi-year horizon regardless of near-term monetary headwinds.
“Solar is now cheaper than coal. Every panel contains silver. The cost crossing IRENA documented this week is the economics permanently favouring the deployment that drives the structural demand. That is not a near-term trade. It is a decade-long direction.”
- IRENA: solar-plus-storage now $54–82/MWh in high-irradiance regions — below new coal ($85/MWh) and new gas ($100+/MWh). The cost crossing is in current-year data, not a projection.
- Solar costs have fallen 87% since 2010. IRENA projects a further 30% reduction by 2030. The cost advantage widens; deployment accelerates.
- Every solar cell contains silver at ~0.5M oz/GW (Silver Institute). Use the calculator above to see silver demand at any deployment level.
- The energy crisis is simultaneously suppressing silver’s monetary price (via oil→inflation→rates) and accelerating the solar deployment that builds its industrial floor.
- The solar industry is migrating to TOPCon/SHJ cells requiring 1.5–2× more silver per GW than legacy PERC — silver intensity per GW is rising as deployment volumes accelerate.
- 70% of silver is byproduct mining — supply cannot respond to demand signals. Four consecutive annual deficits. 2026 projected shortfall: 46.3M oz. The imbalance compounds.
Own silver the professional way. GBI Direct offers fully allocated silver storage through Brinks and Loomis vaults, with institutional-grade custody and live-market liquidity. Accounts open in under 10 minutes.
Sources: IRENA, “24/7 Renewables: The Economics of Firm Solar and Wind” (May 2026); Silver Institute, World Silver Survey 2024/2025; Ghent University / Cattaneo et al., ScienceDirect (2025); Ember, China Cleantech Exports Data Explorer (April 2026); TradingEconomics (silver spot).
Not financial advice. For educational purposes only.